Catch problems before they become incidents
SenseLab agents continuously observe service behavior, deployments, infrastructure state, and resource usage — surfacing early risk signals and explaining what could go wrong before users feel it.
01
SRE Today
Most monitoring tells you when something breaks
Not when it’s becoming unsafe
Healthy systems fail
Dashboards are green until they aren’t. Latency creeps up, error budgets erode, retries spike, and queues back up — but none of it crosses a threshold until customers complain.
Signals are isolated
Metrics, logs, deploys, and infra changes live in separate tools. Engineers notice patterns only after correlating things manually — usually during or after an incident.
Risk accumulates
Overprovisioned resources, unsafe defaults, widening permissions, rising saturation, and unreviewed changes build up over time — unnoticed because they don’t trigger alerts.
02
Where SenseLab Fits In
SenseLab watches for risk Not just failure
SenseLab agents continuously observes how services behave over time — correlating metrics, logs, deployments, infrastructure changes, and resource usage — to identify unsafe patterns, early degradation, and conditions that commonly lead to incidents.
This is not alerting.
It’s supervision.
This is not alerting.
It’s supervision.
03
Where Agents Help
SenseLab agents act like a watchguard
Looking for signals humans don’t have time to track
01
Detect slow degradation
Agents identify gradual changes in latency, error rates, retries, and saturation that stay below alert thresholds but trend toward instability.
02
Correlate behavior with change
SenseLab links abnormal service behavior to recent deploys, config changes, or infrastructure updates — even when effects appear hours or days later.
03
Monitor resource safety
Agents continuously evaluate resource usage and configuration, flagging overprovisioning, underutilization, unsafe limits, and patterns known to precede failures.
04
Identify risky conditions
SenseLab watches for known precursors to incidents: hot partitions, noisy neighbors, queue buildup, retry storms, and dependency pressure.
05
Surface explainable warnings
Instead of alerts, agents surface findings with context: what’s drifting, why it matters, and what could happen if it continues.
04
How It Works
Raia listens, analyzes, acts, and records — always within the policies you define.
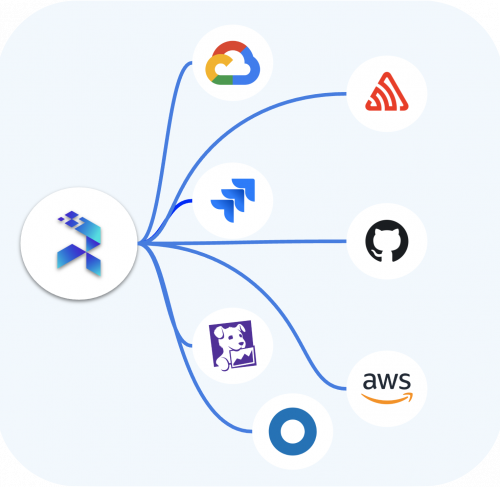
1. Connect your existing tools
Raia integrates with systems like Datadog, Prometheus, Sentry, CloudWatch, New Relic, and more.
2. Define the actions
Set which workflows or actions are safe for agents to run and when they need approval.
3. Agents in action
They correlate data across tools, identify patterns, and take action where it’s safe.
4. Predefined remediations
When a cause matches a known condition (e.g., container crash loop, full disk, high CPU), agents trigger a workflow or action stored in Raia
5. Escalate intelligently
If no matching remediation exists or the risk exceeds defined policy, the agent opens a ticket or sends a Slack alert with full diagnostic context, related metrics, logs, and last actions taken.
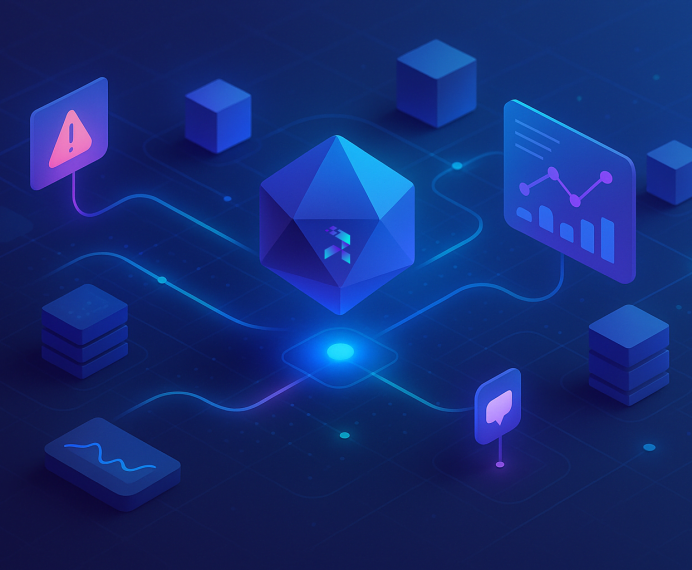
04
How It Works
Continuous supervision across your stack
Connect
SenseLab reads metrics, logs, traces, deploy metadata, and cloud resource state from your existing tools and providers.
Learn
Agents establish baselines for services, dependencies, and environments — including how they normally react to deploys and traffic shifts.
Surface
When risk is detected, agents link together behavior, recent changes, and infrastructure state into a single explanation.
05
FAQs
Answers You Need: Frequently Asked Questions
Get started in just a few minutes
Is this just incident investigation running earlier?
No. Incident investigation starts when something is already broken.
Service Monitoring focuses on detecting unsafe conditions and slow degradation before an incident exists.
If Incident Investigation answers “why is this broken?”,
Service Monitoring answers “this isn’t broken yet — but it’s heading there.”
Do I still need alerts and on-call for this?
Yes. Service Monitoring does not replace alerting or on-call.
It reduces how often alerts turn into incidents by surfacing risks early — so fewer issues ever reach the paging stage.
What kind of things does Service Monitoring catch that incident investigation doesn’t?
Service Monitoring looks for:
Slow latency or error-rate creep below alert thresholds, Risky behavior introduced by recent deploys, Resource over-provisioning or unsafe limits, Dependency pressure and saturation trends, Patterns that commonly precede real outages. Incident investigation focuses on failures that already crossed a line.
Is this replacing our observability stack?
No. SenseLab sits on top of your existing tools.
It connects metrics, logs, deploys, and infrastructure state to explain what they mean together — not replace them.
Why not just tune our alerts better?
Thresholds catch spikes.
They don’t catch drift, compounding risk, or unsafe change patterns.
Service Monitoring exists because most outages don’t start with a spike.
06
Blog
Explore Insights, Tips, and More
Stop Building AI Agent Spaghetti: Why a Control Plane is Your Scalability Lifeline
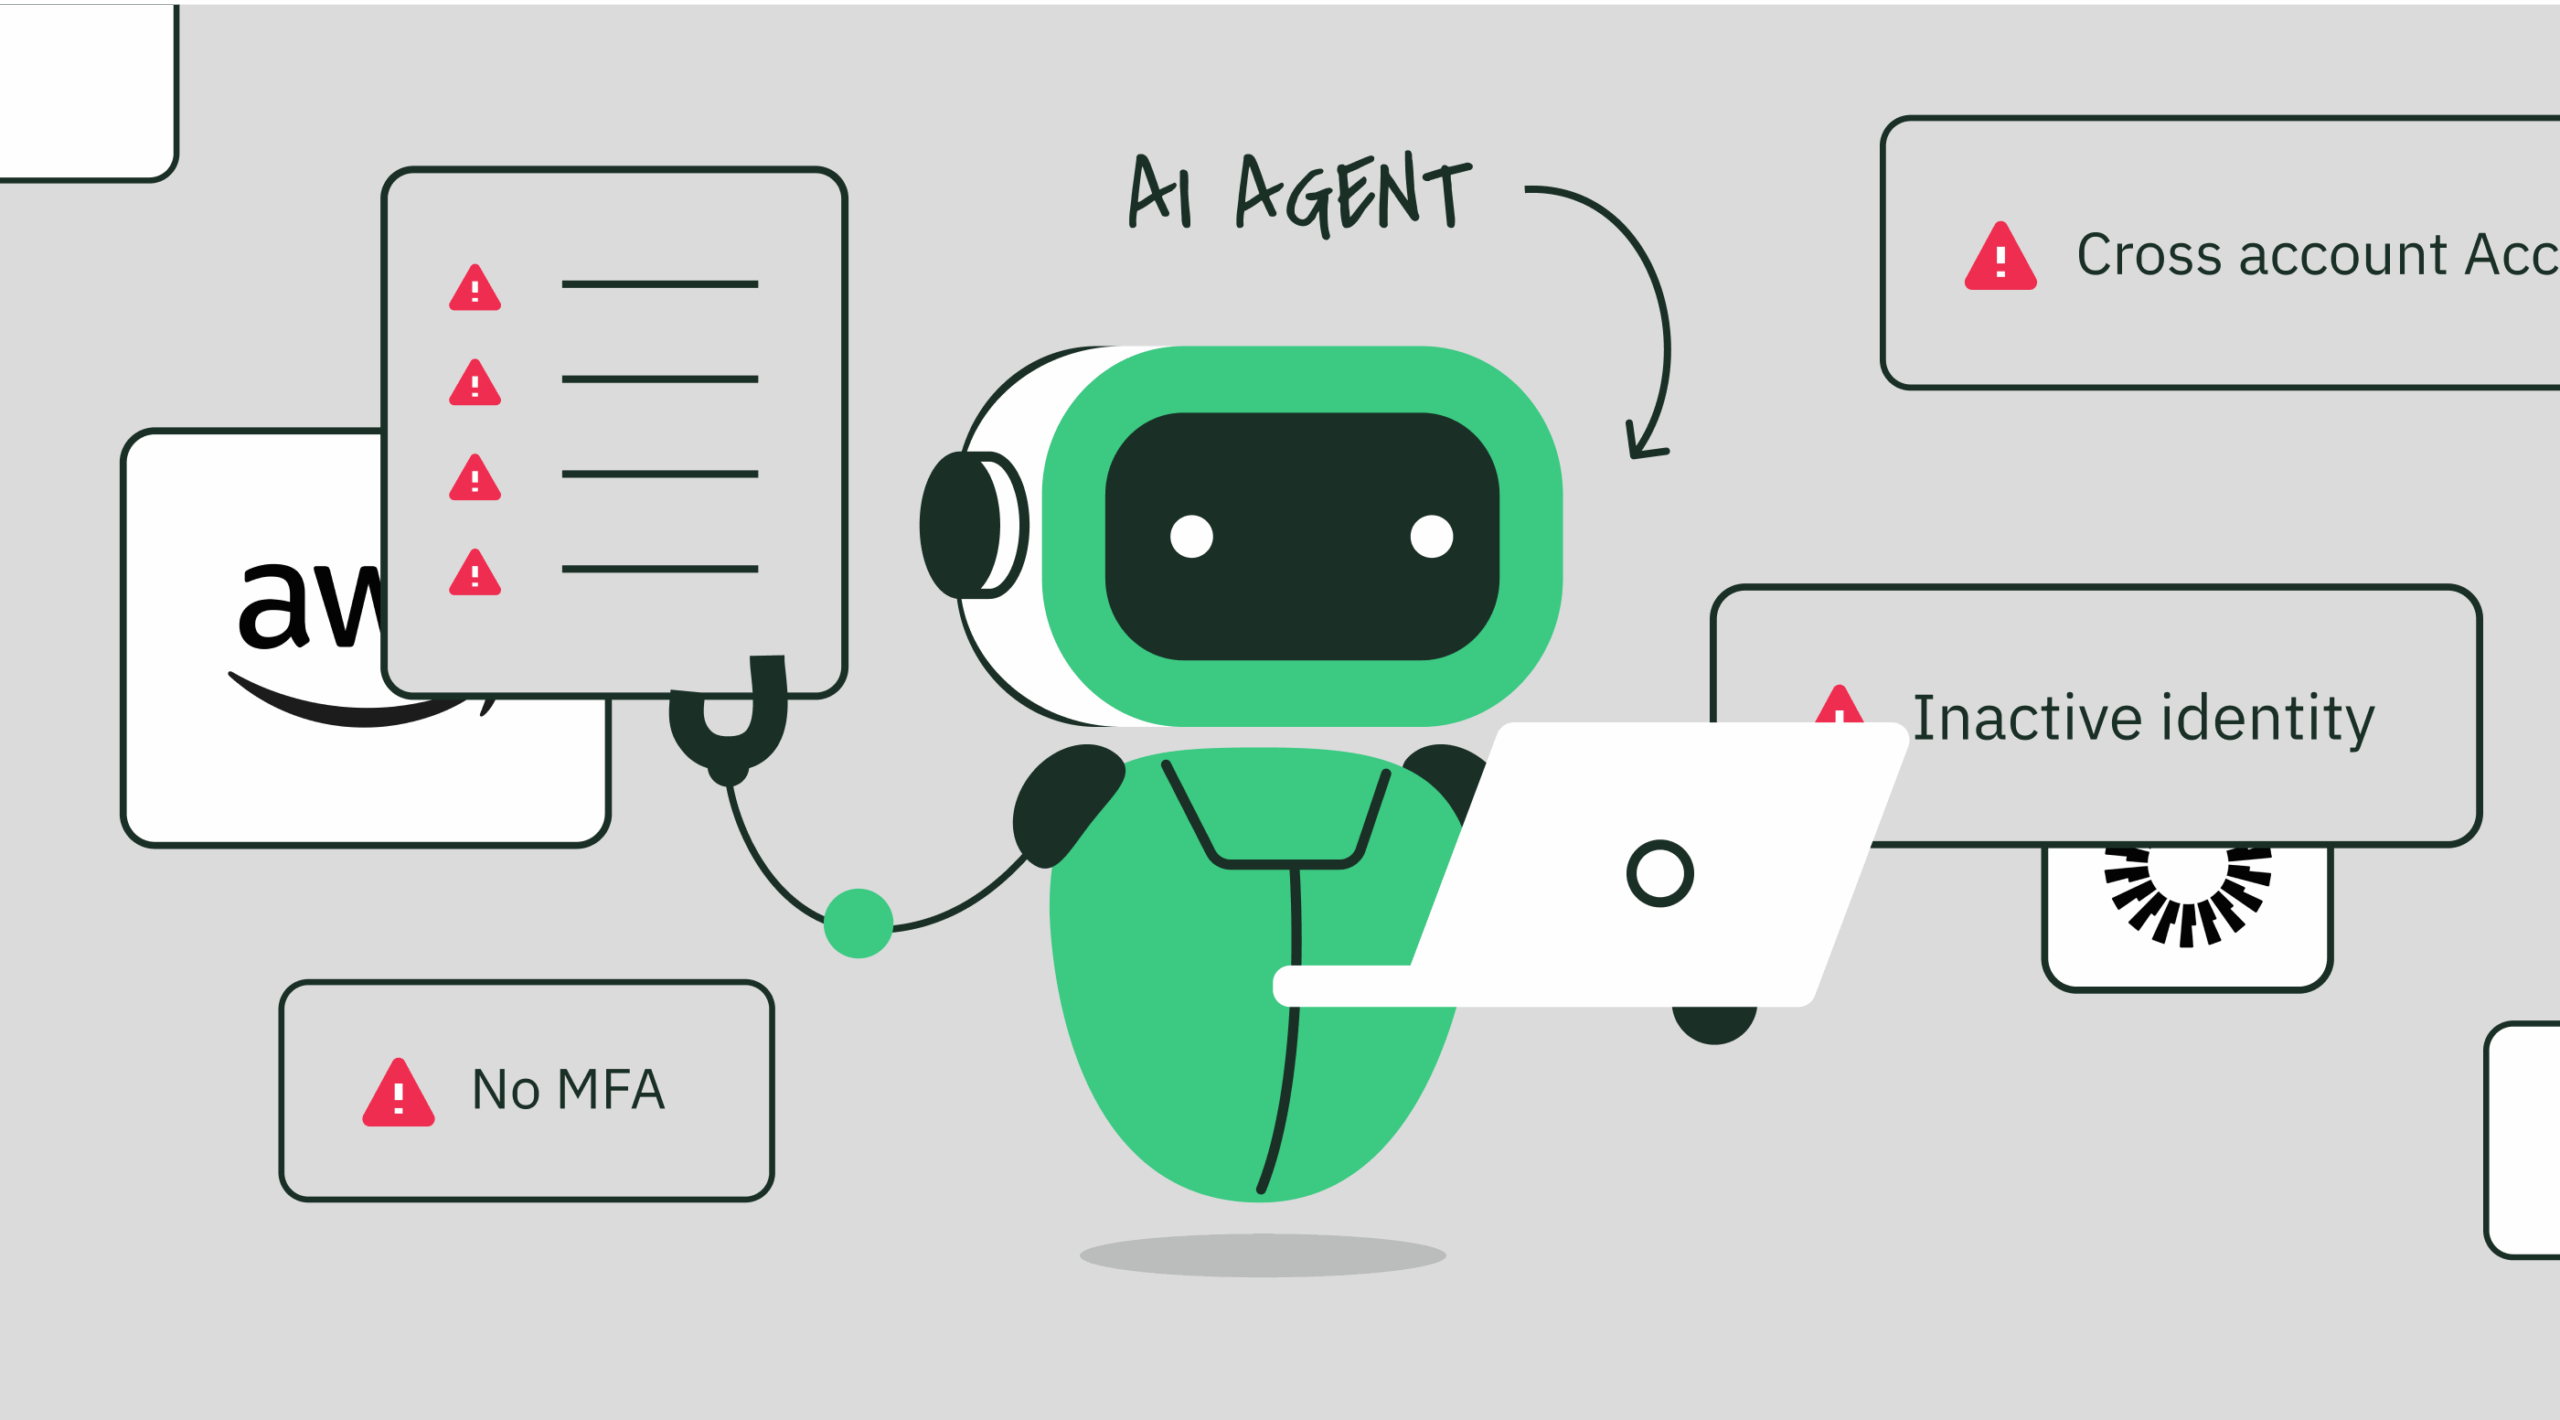
You're building AI agents, and that's exciting. But are you ready to manage them at scale? Without a Control Plane, you're facing a world of pain: prompt engineering nightmares, security vulnerabilities, and innovation[…]
April 26, 2024
Your Agent Army Is About to Mutiny: MCP, Cost Shock, and the Missing ‘Kubernetes’ for AI
We saw containers go from demo to dumpster-fire until Kubernetes stepped in. Now AI agents are exploding 10× faster thanks to MCP—and the invoices land next quarter. Here’s the hard data, the hidden[…]
April 26, 2024
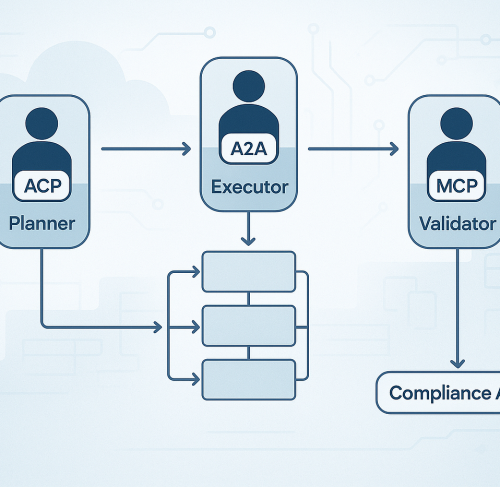
From Tools to Teams: Orchestrating AI Agents Across Protocols
AI agents are no longer just tools on standby. They’re evolving into distributed teams, each with specialized roles, secure access paths, and clear boundaries.
April 26, 2024
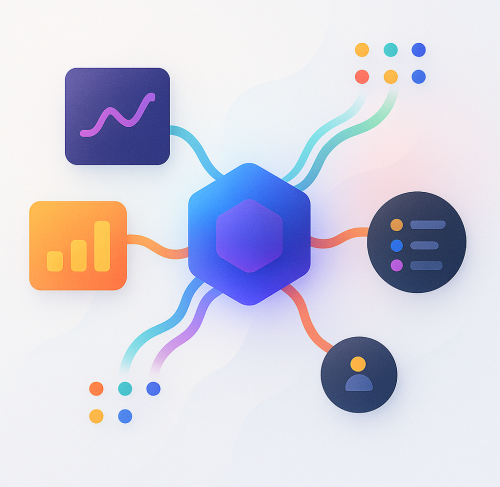
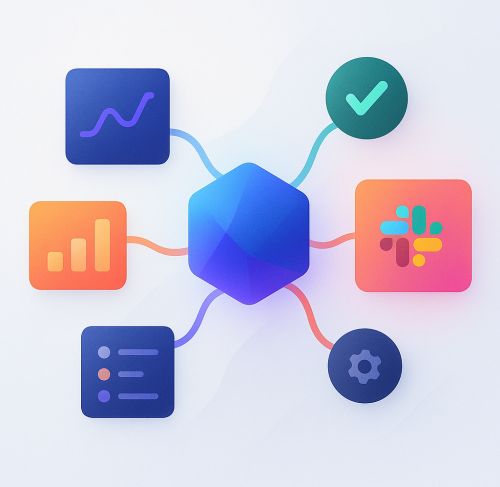
What is Model Context Protocol (MCP)? How it simplifies AI integrations compared to APIs
MCP (Model Context Protocol) is a new open protocol designed to standardize how applications provide context to Large Language Models (LLMs).
April 26, 2024